


Patient selection and data collection
In this study, data from the Korea Community Health Survey (KCHS), conducted by the Korea Disease Control and Prevention Agency (KDCA) from 2009 to 2023, were used12. This study included variables including age, sex, region of residence, household type, household income, basic livelihood security status, smoking status, frequency of alcohol consumption, subjective health level, education level, subjective stress level, and body mass index (BMI) that have been identified in previous literature to affect hypertension and type 2 diabetes mellitus (T2DM)12. A nationally representative sample of 2,704,712 participants was selected for this analysis. The survey spanned 15 years, with participant counts per year grouped as follows: 173,752 in 2009–2010; 505,401 in 2011–2013; 601,864 in 2014–2016; 601,461 in 2017–2019; 200,916 in 2020; 203,437 in 2021; 208,264 in 2022; and 209,617 in 2023 (Figure S1).
The study period was divided into two distinct phases to analyze trends in unmet healthcare needs from 2012 to 2023 and to assess the impact of the COVID-19 pandemic12. The first confirmed case of COVID-19 in South Korea was reported on January 19, 2020, and the World Health Organization officially declared the pandemic on March 11, 202012. Based on these milestones, the period from 2009 to 2019 was defined as the pre-pandemic phase, and 2020 to 2023 as the pandemic phase13. The KCHS database used in this study was fully anonymized, and all participants provided written informed consent. The study protocol was approved by the Institutional Review Board of the KDCA (2010-02CON-22-P, 2011-05CON-04-C, 2012-07CON-01-2C, 2013-06EXP-01-3C, 2014-08EXP-09-4C-A, and 2016-10-01-P-A). This study was conducted in accordance with the ethical principles outlined in the Declaration of Helsinki.
Definitions of unmet healthcare needs and chronic conditions
Unmet healthcare based on data from the KCHS, a nationally representative large-scale survey conducted in South Korea. Respondents were asked the following question: “During the past year, was there ever a time when you needed medical care (excluding dental care), such as an examination or treatment, but did not receive it?” Individuals who answered “yes” were classified as having unmet healthcare needs12. We used this measure as an overall indicator of healthcare access barriers among individuals with hypertension or T2DM, rather than as a condition-specific measure limited to hypertension- or T2DM-related services.
For the present study, we focused on two major chronic conditions—hypertension and diabetes. Individuals with hypertension were identified based on an affirmative response to the question: “Have you ever been diagnosed with hypertension by a physician?“14 Similarly, individuals with T2DM were identified by an affirmative response to the question: “Have you ever been diagnosed with diabetes by a physician?“15 Since responses included both “yes” and “no”, individuals who reported both a diagnosis of either hypertension or T2DM and unmet healthcare needs were classified as patients with unmet healthcare needs related to these specific chronic conditions.
Covariates classification based on a theoretical framework
Anderson’s model of healthcare utilization is a tool based on a social system approach and is supported by decades of empirical evidence16. According to this model, healthcare access is determined by three key factors: predisposing factors, enabling/disabling factors, and need factors. In this study, the Anderson model was applied to patients with hypertension and T2DM to analyze the factors affecting their unmet healthcare needs.
Preceding factors reflected the individual’s propensity to use healthcare. They included variables such as age groups (30–44, 45–64, 65–74, and ≥ 75 years), sex (male and female), BMI groups (underweight, normal, overweight, and obesity), region of residence (urban and rural), household type (single-person households, one-generation household excluding single-person households, two-generation households, and over three-generation households), and education level (elementary school or lower education, middle school, high school, and college or higher education)17. Similarly, enabling/disabling factors are variables that can facilitate or hinder access to medical care, such as household income (low [< 2 KRW million per month], middle [2–5 KRW million per month], high [≥ 5 KRW million per month]), and basic livelihood security status (current recipient, ex-recipient, and non-recipient).
Finally, we included variables such as subjective health level (low, normal, and high), subjective stress level (low, middle, and high), frequency of walking for at least 10 min (< 1, 1–2, 3–4, and ≥ 5 times per week), smoking status (current smoker, ex-smoker, and non-smoker), and frequency of alcohol consumption (< 1, 1–4, and ≥ 5 times per month) as need factors indicate the potential need for medical service use. In this study, BMI groups were classified as underweight (< 18.5 kg/m2), normal weight (18.5–22.9 kg/m2), overweight (23.0–24.9 kg/m2), and obese (≥ 25.0 kg/m2) groups, according to the Asia-Pacific guidelines18.
Statistical analyses
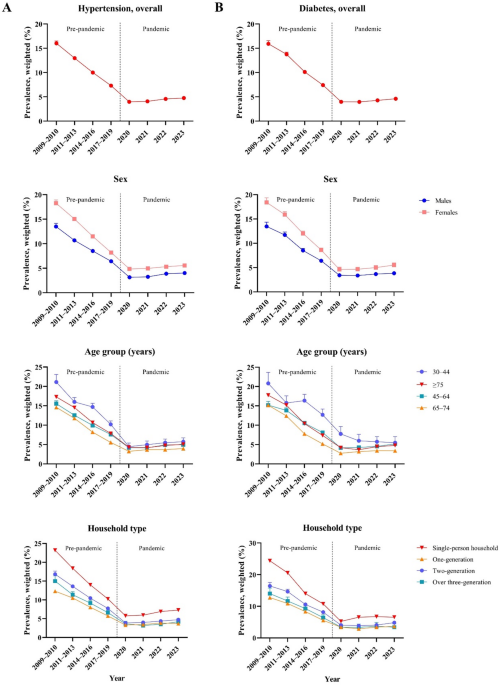
This study examined the overall population characteristics and performed a complex-sample analysis to identify temporal trends in the prevalence of unmet healthcare needs among individuals with hypertension and T2DM. To assess changes in the slope of these trends associated with the COVID-19 pandemic, weighted linear regression models were fitted separately for the before the pandemic (2009–2019) and during the pandemic (2020–2023) periods. Differences in β-coefficients (βdiff) were used to quantify shifts in both the direction and magnitude of the temporal trends. Vulnerable subgroups were identified according to covariates defined on the basis of the Andersen’s behavioral model, including predisposing, enabling/disabling, and need factors. Within each covariate, weighted odds ratios (wORs) and 95% confidence intervals (CIs) were calculated using logistic regression, with variance estimates obtained via Taylor series linearization19,20. Ratios of wORs (RORs) were additionally calculated to compare subgroup associations between the before pandemic and during pandemic periods. Further details of the analysis are provided in the Supplementary Methods . All statistical tests were two-sided, and a p-value < 0.05 was considered statistically significant. Analyses were conducted using SAS software, version 9.4 (SAS Institute, Cary, NC, USA).
link