
Longitudinal trends in schizophrenia among older adults: a 12-year analysis of prevalence and healthcare utilization in South Korea

Numbers of patients and schizophrenia prevalence
Table 1 lists the demographic and clinical characteristics of the subjects. Over the 12-year period from 2010 to 2021, 420,203 schizophrenia patients were identified, of whom 50.9% were female. Of all patients, 63.8% were covered by health insurance, 36.1% were medical aid recipients, and 0.1% were veterans. Table 1 shows the year-wise distribution of initial schizophrenia diagnoses over the years, and the percentages of females; the sex distribution was quite stable over time.
Table 2 lists the numbers of patients, schizophrenia prevalence, and the proportions of medical aid beneficiaries by age group over the years, and the results of linear regression used to analyze changes over the years in each dependent variable for the entire sample, and older and younger adults. The number of patients and the schizophrenia prevalence significantly increased over the years in both age groups, as revealed by linear regression (all p < 0.001). Of younger adults, the number of patients increased from 140,752 in 2010 to 155,946 in 2021; the prevalence rose from 0.51% to 0.65%. The increase was more pronounced in older adults; patient numbers grew from 82,556 to 188,359 and the prevalence increased from 0.58% to 0.89% over the same period. Additionally, the proportion of older schizophrenia patients among all patients significantly increased over the study period (p < 0.001), rising from 37.0% in 2010 to 54.7% in 2021; the age distribution of schizophrenia patients shifted substantially. Figure 1 illustrates these trends, highlighting the differences in the rates of increase between older and younger adults. The LMM data in Table 4 show that the rises in both patient numbers (p < 0.001) and schizophrenia prevalence (p = 0.002) were significantly faster in older than in younger adults.
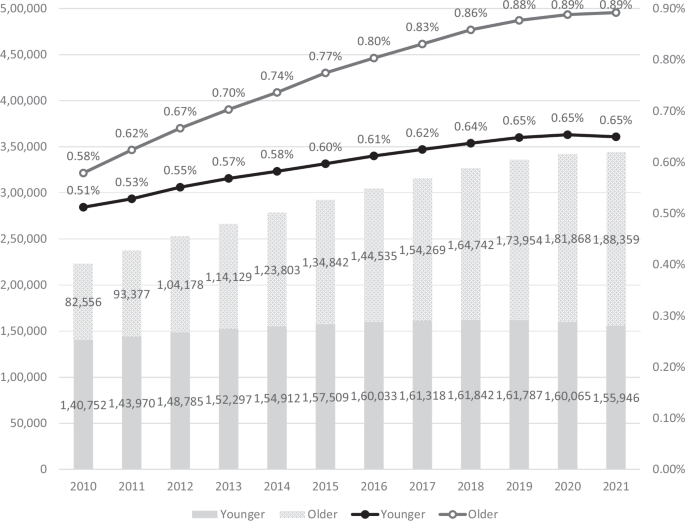
The annual numbers of schizophrenia patients and the annual schizophrenia prevalence are presented as a bar plot and a line graph respectively. Dark gray bars: numbers of younger patients; light gray bars: numbers of older patients. Black line: prevalence among younger patients; gray line: prevalence among older patients. All subgroups exhibited significant increases in both numbers and prevalence over the years. The linear mixed model (LMM) confirmed that, over the years, the older group exhibited significantly higher increases in both numbers (B = 8.24E + 3, p < 0.001) and prevalence (B = 1.60E−4, p = 0.002) than did the younger group.
Proportion of medical aid beneficiaries
The proportion of medical aid beneficiaries varied over the years between age groups (Tables 2 and 3). A significant decrease from 34.7% to 24.5% (p < 0.001) was observed in younger adults. However, in older adults, the proportion fluctuated little, with the initial (2010) and final (2021) years of the study at 44.9%, and no significant trend was observed over the years (p = 0.529). Table 4 shows a significant difference in the change in the proportion of medical aid beneficiaries between the age groups (p = 0.001), suggesting that older adults with schizophrenia consistently remain beneficiaries compared to younger adults.
Supplementary Table 3 contains detailed information on subject distribution by insurance type (health insurance, medical aid, and veteran assistance) for each year from 2010 to 2021, and also the proportion of medical aid beneficiaries within each age group over the same period. This highlights the changes in insurance status across the different age categories.
Comorbidity burden
As shown in Fig. 2, the CCI scores in both age groups significantly increased (p < 0.001). The scores in older adults increased from 2.12 to 2.60, while those of younger adults increased from 0.88 to 1.02 during the same period. Notably, the older patient group consistently maintained higher CCI scores than the younger group. As shown in Table 5, there was a significant difference in the change in the CCI score between the age groups (p < 0.001), supporting this widening gap.
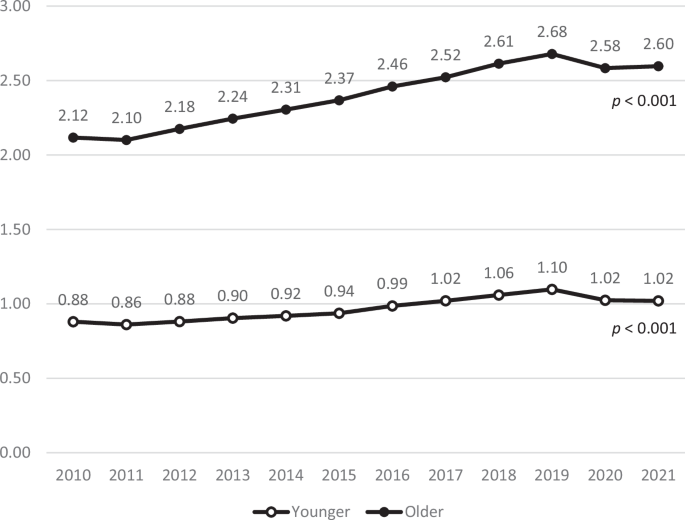
The annual average CCI score is presented as a line graph. Black line: CCI scores in older patients; gray line: CCI scores in younger patients. Both age groups showed steady increases in CCI scores over time, with the older group maintaining consistently higher values.
Annual lengths of hospitalization
Figures 3 and 4 illustrate the annual average lengths of hospitalization by age group and insurance type, separated into psychiatric and non-psychiatric hospitalizations, respectively.

The annual average length of psychiatric hospitalization by age group and insurance type. A Age group. B Insurance type.

The annual average length of non-psychiatric hospitalization by age group and insurance type. A Age group. B Insurance type.
The overall hospitalization period for psychiatric hospitalizations increased over time, with divergent patterns between age groups: hospitalization significantly increased in older adults from 230.2 days to 251.8 days (p = 0.023), whereas it significantly decreased in younger adults (p < 0.001). Among insurance types, the health insurance group significantly increased from 133.3 days to 155.0 days (p < 0.001), while the medical aid group hospitalization days increased slightly but not significantly (p = 0.119) from 246.8 days to 265.3 days. The veteran group decreased from 159.8 days to 144.1 days with substantial year-to-year fluctuations, although not significant (p = 0.576). Notably, older adults and the medical aid group exhibited a sudden decrease in hospitalization duration between 2016 and 2017.
The overall hospitalization period increased over time (p = 0.003) for non-psychiatric hospitalization with older adults increasing from 35.6 days to 37.9 days and younger adults decreasing from 16.5 days to 16.2 days. The health insurance group significantly decreased from 27.8 days to 24.8 days (p = 0.003), while the medical aid group significantly increased from 26.8 days to 37.0 days (p < 0.001). The veteran group significantly decreased from 69.8 days to 41.9 days (p = 0.010), with substantial year-to-year fluctuations.
Table 6 lists the results of an LMM analysis that examined the effects of year, age group, and insurance type on the annual length of hospitalization for psychiatric and non-psychiatric cases.
Initially, older adults exhibited significantly longer psychiatric hospital stays than younger adults (B = 37.57, p < 0.001). The Year*Age group interaction revealed that older adults experienced a significantly more rapid increase in hospitalization length over time (p < 0.001), indicating a widening gap between age groups that is expected to continue. Compared to the medical aid group (reference), both health insurance and veteran groups initially had significantly shorter hospitalizations (B = −110.39 and −101.55, respectively, both p < 0.001). Over time, the gap between health insurance and medical aid groups narrowed (p < 0.001), while the veteran group did not change significantly (p = 0.962).
Initially, older adults also had significantly longer non-psychiatric hospital stays (B = 17.27, p < 0.001). The Year*Age group interaction indicated a similar widening gap between age groups over time (p < 0.001). Compared to the medical aid group, the health insurance and veteran groups initially had significantly longer hospitalizations (B = 2.85 and 35.40, respectively, both p < 0.001). Hospitalization length significantly decreased in the health insurance and veteran groups (B = −0.94 and −1.86, respectively, both p < 0.001), indicating a converging trend among insurance types.
These LMM results support the trends apparent in Fig. 3 for psychiatric and Fig. 4 for non-psychiatric hospitalizations, providing insights into the relative changes in hospitalization duration among different insurance types and age groups.
Healthcare utilization patterns
Figures 5 and 6 show the annual proportions of healthcare facilities used by older and younger adults, separated into psychiatric and non-psychiatric hospitalizations. The facilities were tertiary/general hospitals; hospitals/nursing homes; and, clinics. Significant changes in the utilization of healthcare facilities were apparent over time.

A Younger adults. B Older adults.

A Younger adults. B Older adults.
For psychiatric hospitalization, the proportion of tertiary/general hospital users significantly increased among younger adults from 2010 to 2020 (from 20.1% to 23.1%, p = 0.048), with a rate of 19.9% in 2021. The proportion of hospital/nursing home users significantly increased from 67.9% to 76.9% (p < 0.001), and the proportion of clinic users significantly decreased from 12.0% to 3.2% (p < 0.001). Among older adults, the proportion of tertiary/general hospital users significantly decreased from 15.2% to 9.5% (p < 0.001), whereas the proportion of hospital/nursing home users significantly increased from 76.9% to 88.5% (p < 0.001), and the proportion of clinic users decreased from 8.0% to 2.0% (p < 0.001).
For non-psychiatric hospitalization, the proportion of tertiary/general hospital users among younger adults significantly increased from 40.9% to 53.1% (p < 0.001), while the proportion of hospital/nursing home users significantly decreased from 51.4% to 39.6% (p < 0.001). The proportion of clinic users decreased slightly from 7.7% to 7.3% but the change was not significant (p = 0.258). Among older adults, the proportion of tertiary/general hospital users significantly increased from 42.6% to 46.8% (p < 0.001), whereas the proportion of hospital/nursing home users significantly decreased from 52.3% to 48.9% (p = 0.001), and the proportion of clinic users significantly decreased from 5.1% to 4.3% (p < 0.001). Supplementary Table 4 shows the detailed linear regression data for the changes in healthcare facility utilization patterns by age groups.
The LMM data of Supplementary Table 5 reveal trends in healthcare utilization patterns over time and between age groups. For psychiatric hospitalization, tertiary/general hospital utilization showed no significant differences between age groups initially (p = 0.953) or in temporal changes (p = 0.306), with no significant overall change over time (p = 0.952). For hospitals/nursing homes, no initial difference was detected between the age groups (p = 0.887), but utilization significantly increased over time (p = 0.044), with both groups showing similar trends (p = 0.664). Utilization of clinics significantly decreased over time (p < 0.001), older adults showing significantly lower initial utilization (p < 0.001) and a slower decrease in utilization compared to younger adults over time (p < 0.001).
No significant differences for non-psychiatric hospitalization were observed in tertiary/general hospitals and hospitals/nursing homes between the age groups initially (p = 0.083 and p = 0.089, respectively) or in temporal changes (p = 0.410 and p = 0.380), with no significant overall change in utilization (p = 0.991 and p = 0.999). Older adults initially utilized clinics at a significantly lower rate (p < 0.001), but no significant difference in the temporal change was observed between the groups (p = 0.380) or overall utilization pattern (p = 0.338).
These results align with the trends observed in Figs. 5 and 6, demonstrating a shifting pattern in healthcare facility utilization. The hospital/nursing home utilization rates for psychiatric hospitalizations in both age groups significantly increased over time, with older adults consistently exhibiting a higher utilization rate. In contrast, the utilization of tertiary/general hospitals remained stable in both groups, while clinic utilization significantly decreased in both age groups. These patterns contrasted with non-psychiatric hospitalization, which showed relatively higher utilization of tertiary/general hospitals and lower utilization of hospitals/nursing homes.
link


